We have now delivered one of the most advanced Blippa projects this year: The Waxholm Gästhamn (guest harbour).
Previously, boat guests had to walk to the harbour office and purchase a ticket. The ticket was to be applied to the boat, so you had to walk back to the boat to apply it.
Now, there are shiny QR signs at each mooring spot.
Each QR sign is connected to one of the 30 mooring spots.
With this, it´s easy to check if payment has been made.
To make things easy for the harbour masters, a status page appears when they scan the QR code (using the Rules function for the staff role).
Also, we made a simple map with icons to show the payment/availability status:
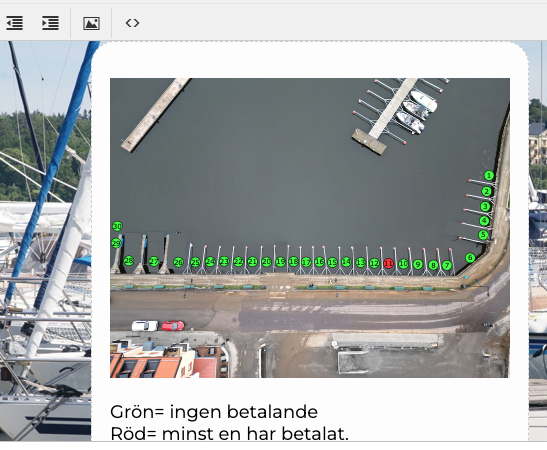
(Click here for a live version of the map)
To make this, we first created a Data Source, consisting of a Google Sheet. The sheet stores the status and the number of valid payments for each spot.
(One boat owner can pay for the whole day and then leave, making the spot available for the next boat. So, a spot is made red (occupied) when at least 1 valid payment is active. Note: The boat that is currently occupying the spot might not have paid for a ticket; this needs to be monitored by the harbour staff.)
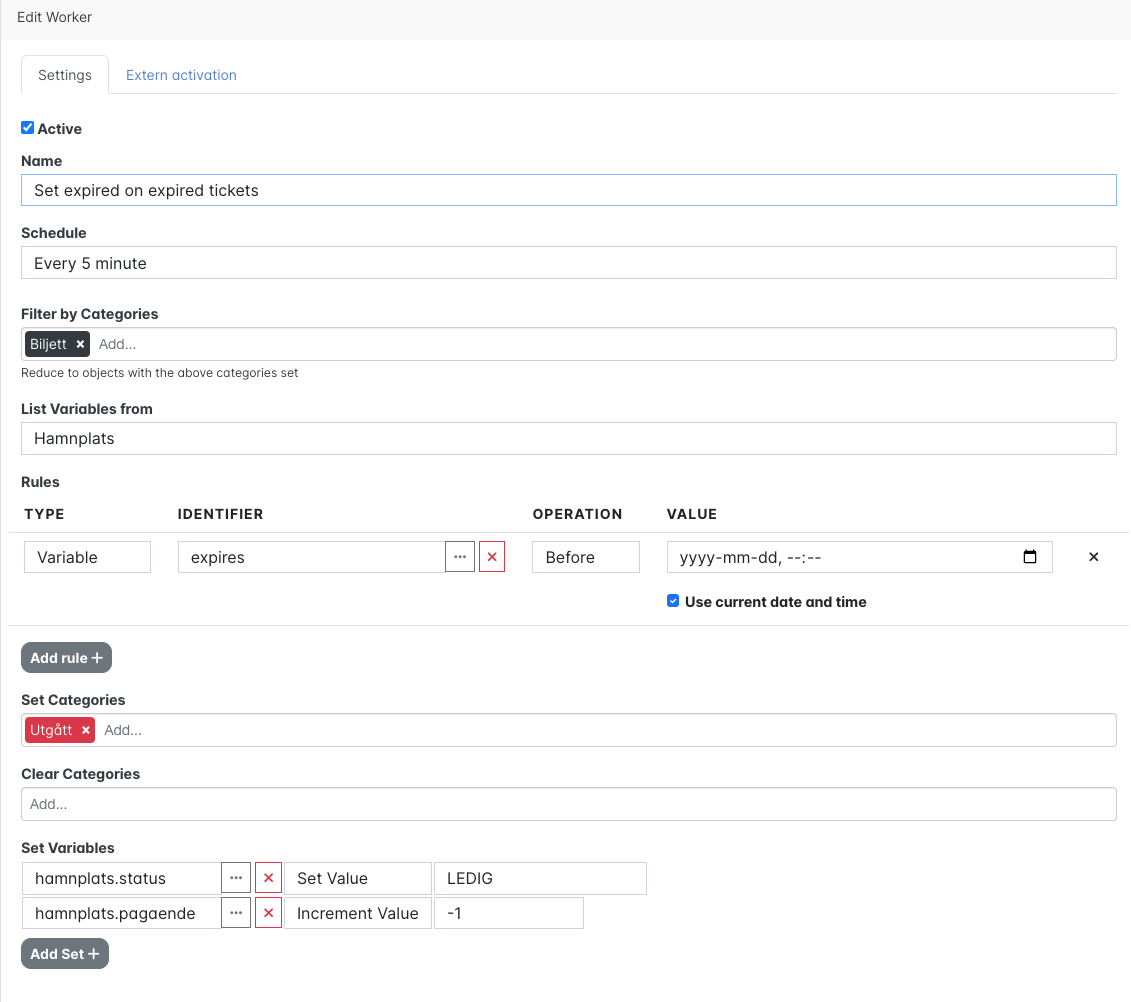
Then we created a Worker to change the category when the ticket has expired. (Using categories instead of variables is needed for performance reasons since the category is “outside” of the data, compared to using variables that force Blippa to look “inside” each object data.
Also, the Worker deduct one payment from the Data Source when the ticket has expired:
Then we used the “Computed Fields” to define the colours of each state (Paying/Available)
We selected green as available and red as occupied/paid.
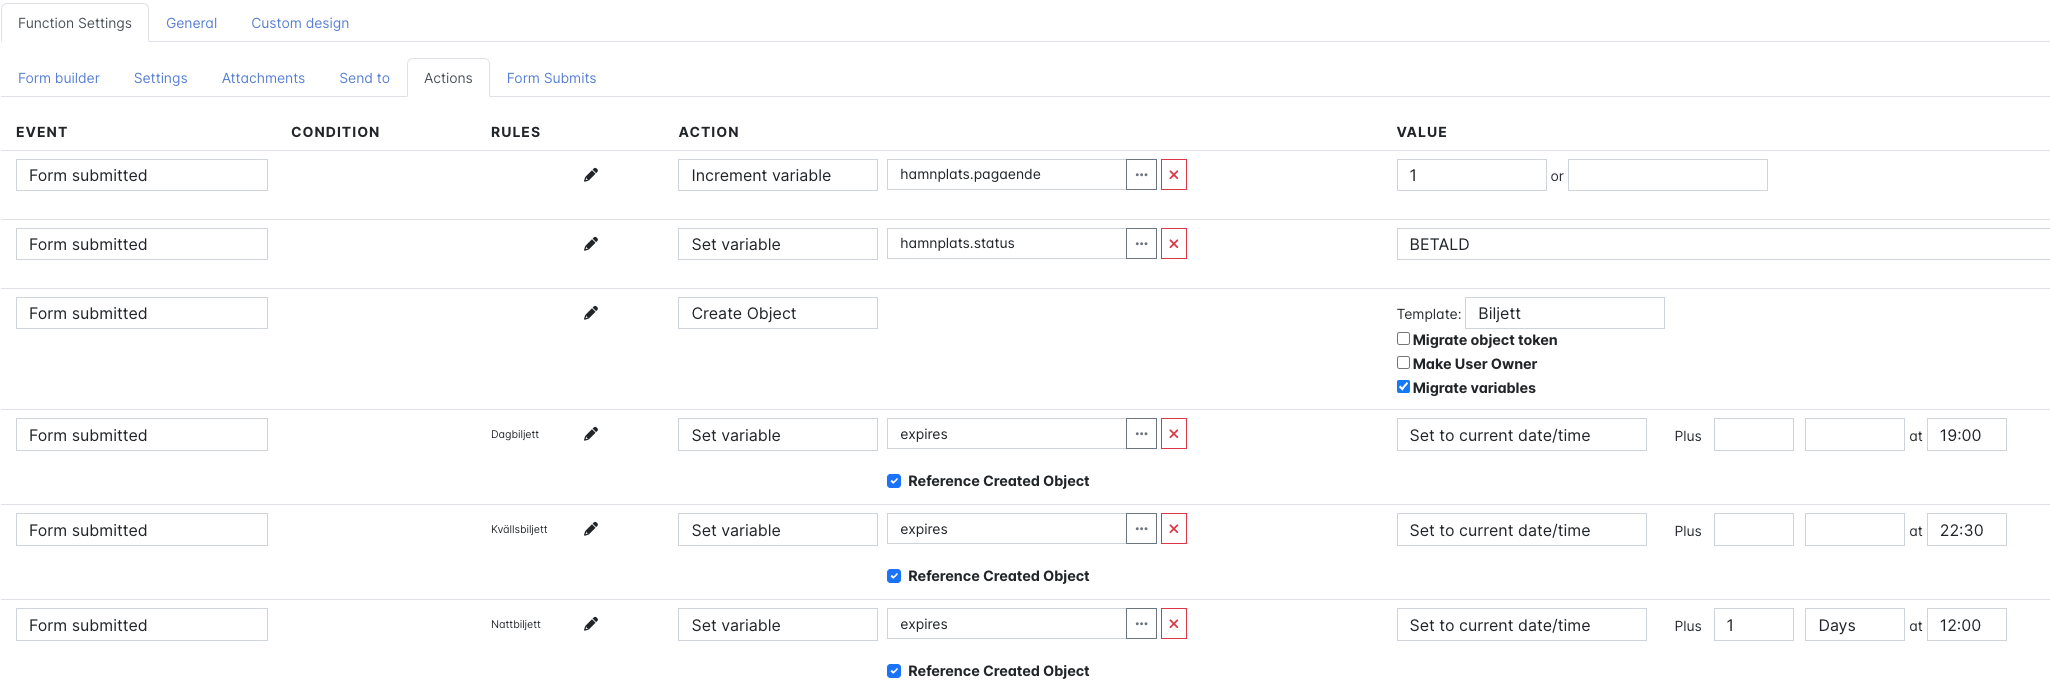
In the payment Form, we added some Actions to set the status, time expires etc.
Also, in the Payment form, we used some magic to calculate the price:
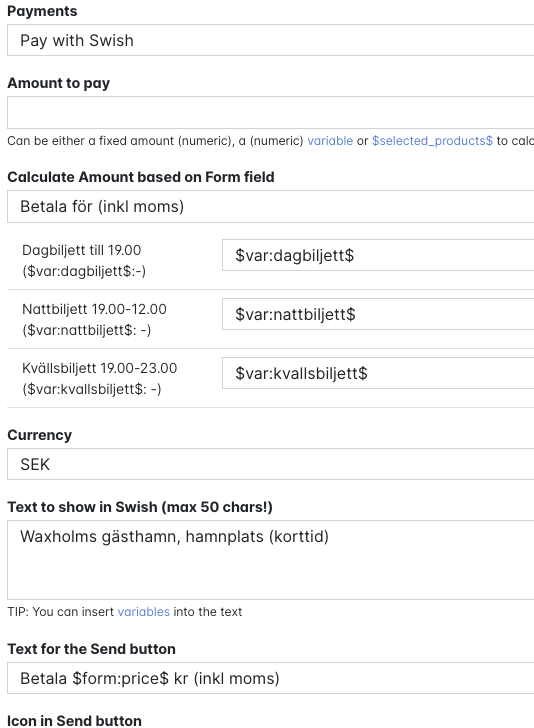
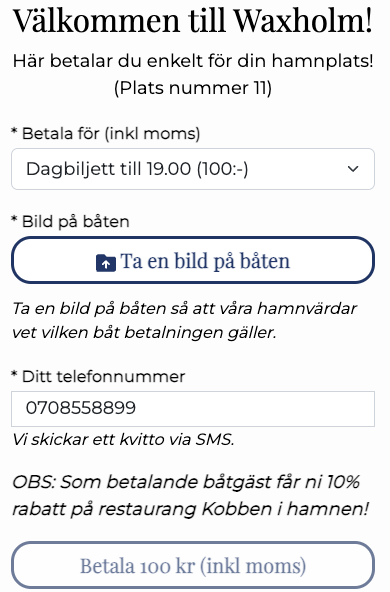
This is how the payment form looks like for a customer (sorry, Swedish only for now):
The customer takes a picture of the boat (since there can be multiple payments for each spot), enters the phone number and pays using Swish. (We are waiting for the harbour to get their Stripe account to activate credit card, Apple Pay and Google Pay payment options).
To make the map, we created an SVG file with code that selects the row in the Data Source: (In this code sample, row 30 corresponds to spot 30)
<svg viewBox="10.097 243.559 20 20" width="20" height="20">
  <g transform="matrix(1, 0, 0, 1, -709.903381, 1.558906)">
    <circle cx="730" cy="252" r="10" stroke="black" stroke-width="1" fill="$var:platser.Rows(30).statuscolor$"></circle>
    <text font-size="14" fill="black" font-family="Verdana" text-anchor="middle" alignment-baseline="baseline" x="730" y="257" style="white-space: pre; font-size: 14px;">30</text>
  </g>
</svg>
Note: the secret sauce is in the:
fill="$var:platser.Rows(30).statuscolor$"></circle>
On top of this, we developed a Payment Report that automatically sends an Excel spreadsheet every month with payment details for the harbour bookkeeping. Plus some other stuff, like discounts etc. etc
So, the most complicated Blippa project in a long time.
Supported by Blippa Professional Services ![]()